
SKU's
60 to 100
Reporting
Weekly
Time
Real

A leading American publisher required the support of RGIS. The publisher’s products are printed and distributed to retailers, bookstore chains, independent bookstores, libraries and museums across America.
THE CHALLENGE
The leading American publisher needed a solution to understand how and where their products were being displayed within multiple retailers.
The publisher required RGIS to provide the following:
- National coverage to cover any retailer stocking their products
- Take photos of the products on site
- Report any variances
- Control costs by cross-referencing RGIS inventory in-store visits to complete the data collection in targeted retail locations
- Weekly reporting
Recent Case Studies
Why RGIS?
Customers choose RGIS for surveys of products across multiple retailers because our consistent, accurate data collection provides comparable insights that help brands understand market presence, pricing, and compliance across all locations.
Our Solutions
The leading American publisher partnered with RGIS to complete the product survey within multiple retailers, and RGIS provided the following:
Identified stores and pharmacies that stocked the customer’s products
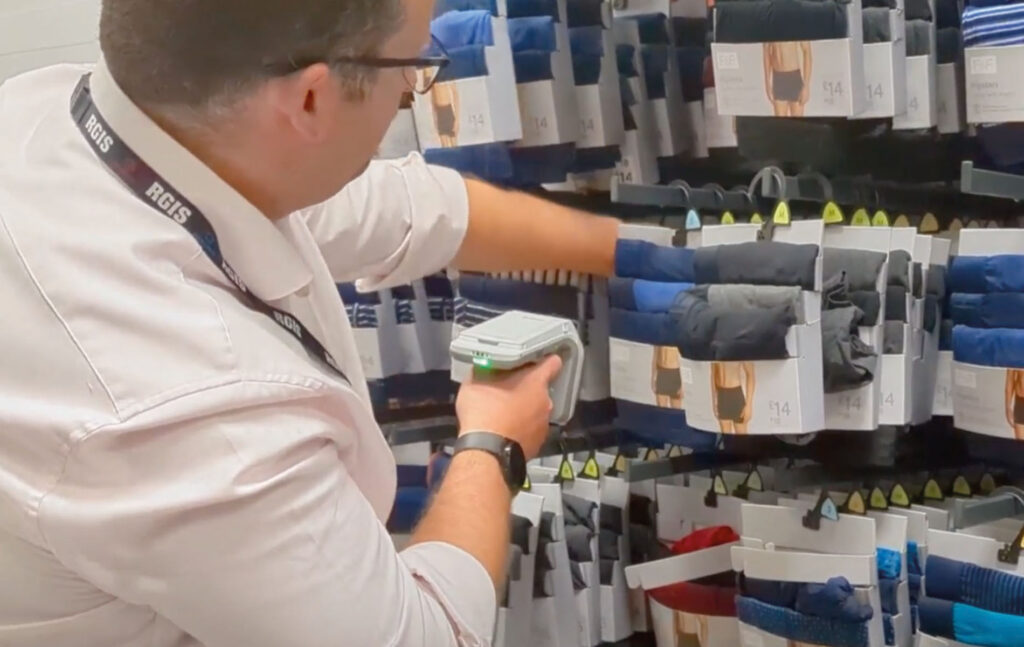
During the main inventory event, one experienced RGIS auditor used a tablet to capture a photo and fill in the requested data questionnaire on site
Data captured included rack location, rack type and each UPC
Average of 60-100 SKUs recorded
Results
The leading American publisher found by outsourcing the product survey within multiple retailers to RGIS, the following results were achieved:
Received weekly reporting of the requested data for the prior week’s stores, and a zip file of rack photos
Validated numbers, as RGIS were able to compare returned SKUs against the customer’s active SKU list
More store locations were provided than expected, with a higher degree of accuracy than the customer had previously been receiving
The data allowed an unbiased verification of the location and condition of their displays
Utilized weekly reporting to hone in on variances in inventory and determine the root cause of discrepancies
Understood in-store conditions in a sample of stores across several chains, in several regions in real time
Monitored implementation of seasonal initiatives through data and photos

Conclusion
By outsourcing the multi-retailer product survey to RGIS, the publisher gained highly accurate, unbiased weekly reporting—with validated SKUs, expanded store coverage, real-time visibility of display conditions, and photo evidence—which enabled them to identify inventory variances, investigate root causes, and closely monitor seasonal initiatives across multiple chains and regions.