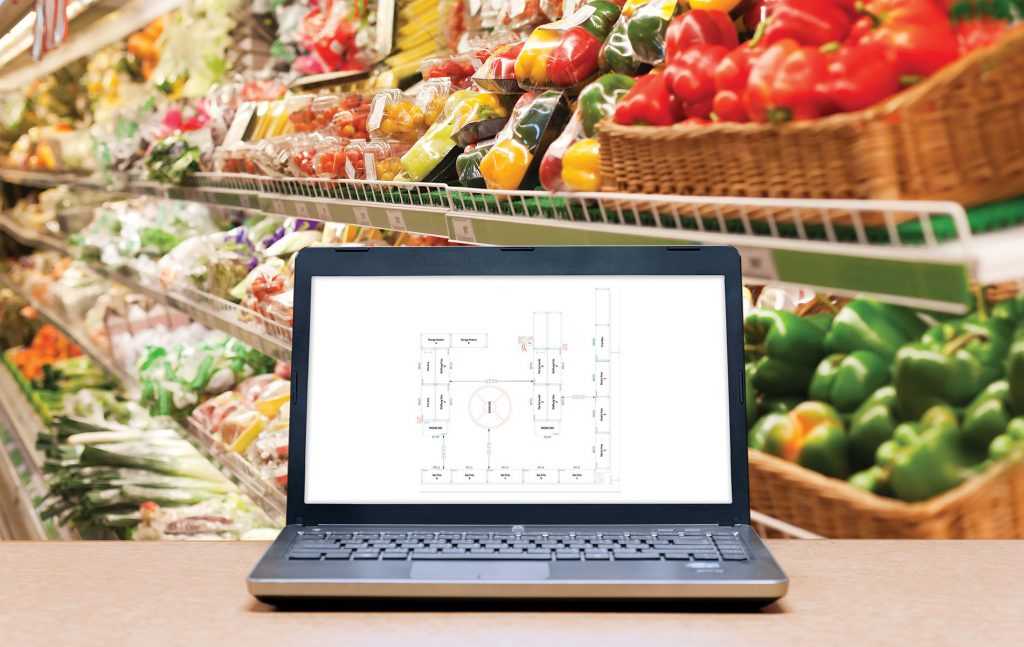
Create New and Update Existing Store Surveys for Retailer with SmartSpace® Software
Case Study
Read Full Case Study
A complete solution for all store inventory data to visualize stores in their entirety
Contact usAccess to a Data Analyst without having to employ staff full time

Understand data, inventory trends and store performance
Bespoke reporting focusing on your KPIs and targets
Data to analyze and assess business performance and challenges
Insight into selling space, floor plans, fixtures, planograms and store conditions giving full store analytics
Geolocation of products on the map
Analyze good positioning of the products on shelves to locate inventory accurately and quickly
Comparative analysis between multiple stores

With reach across the USA, RGIS gives excellent geographic coverage for all of your stores
Real-time in-store data capture and QA using CAD-like tools
Proven methods and history for providing highly accurate information
Ability to output information directly to AutoCAD and macro space software files
Integration of inventory data into the 2D plan
Unbiased results from a trusted third party
Increased understanding of stores reduces out of stocks and over stocks