Large Scale Pushfeed Installation Project for Major Soft Drink Manufacturer
Case Study
Read Full Case Study
Data
Inventory
Analyzed
Data
Multiple
Users
Sainsbury’s Loss Prevention Department partnered with RGIS to gain greater insights into a largely unused data set that would not have been a priority for internal reporting teams:
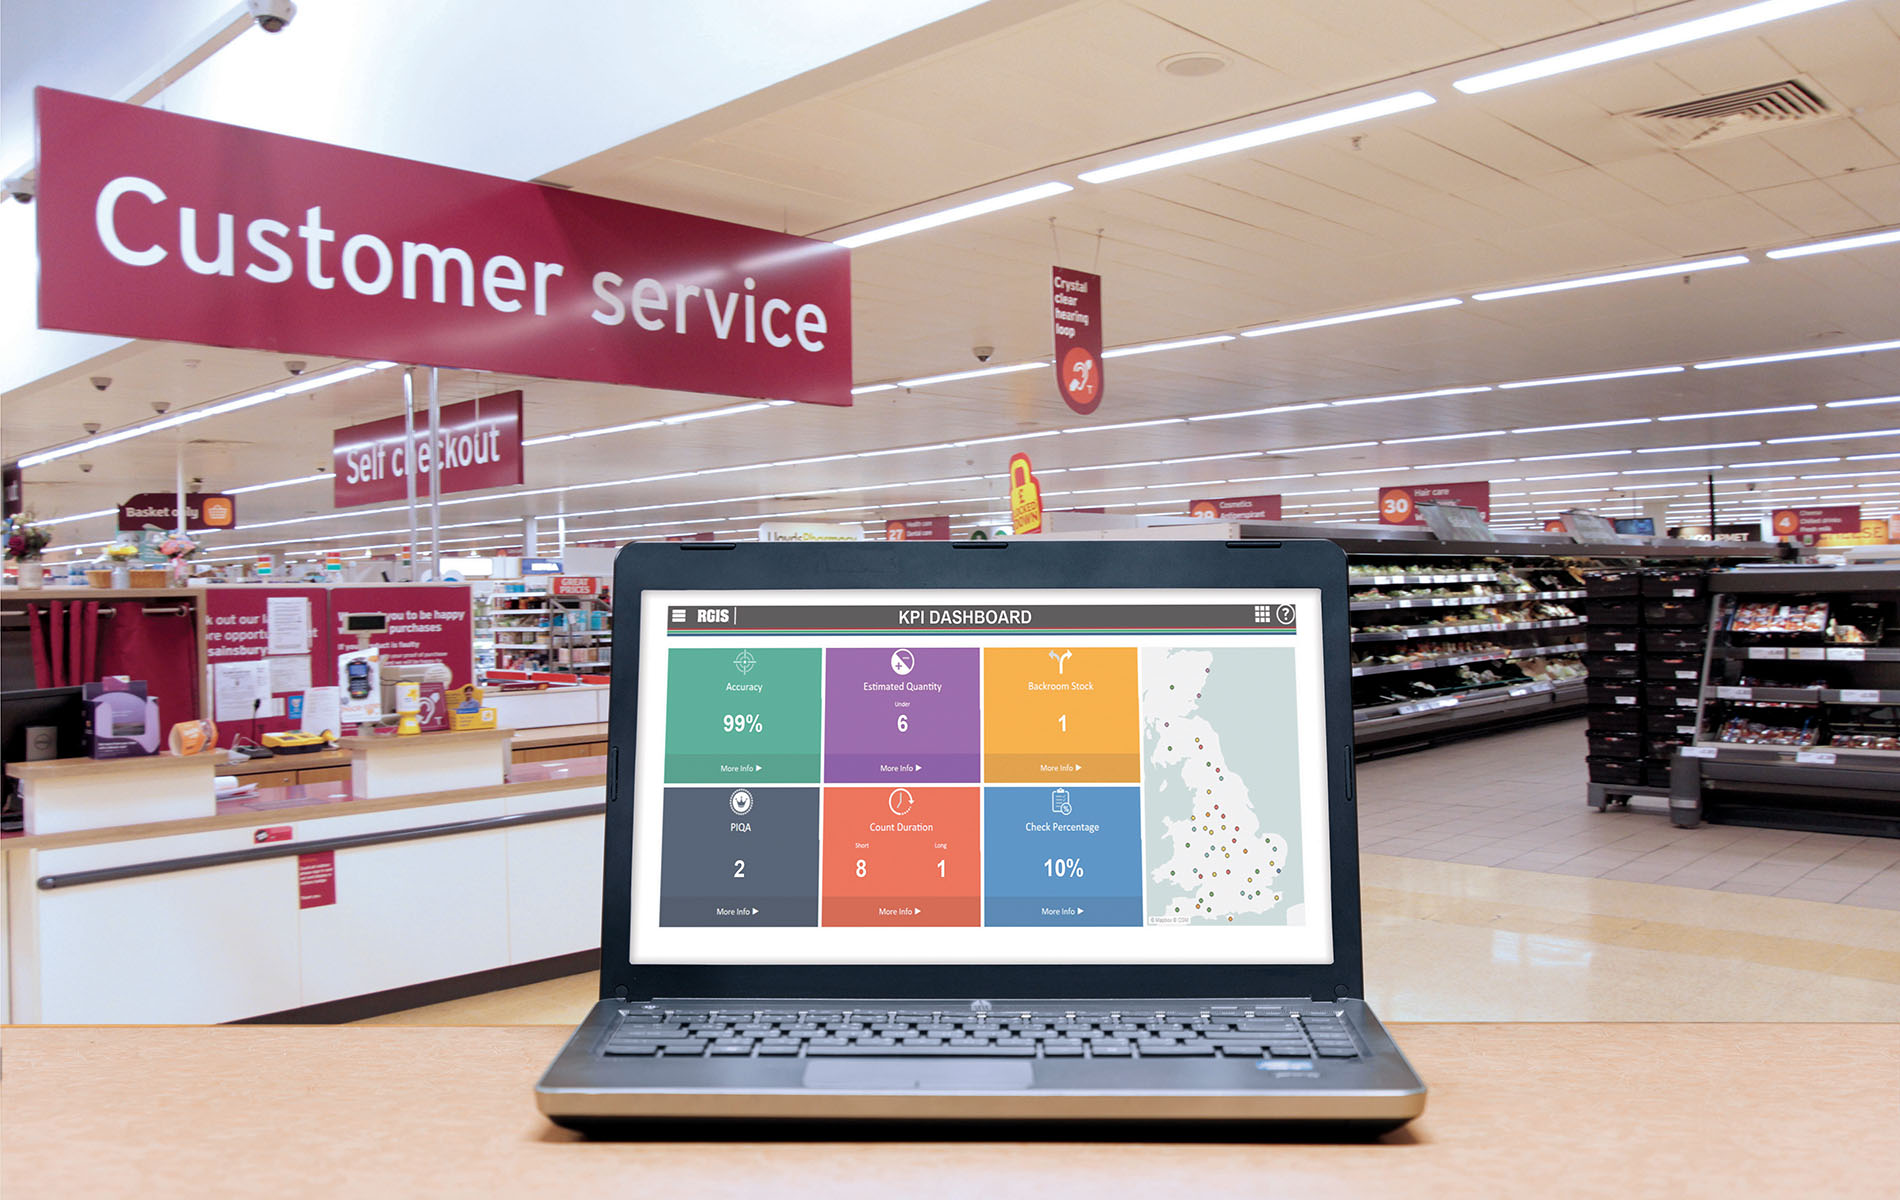
Customers choose RGIS to analyze inventory data using the RGIS dashboard because our real-time, visual reporting provides instant insight into trends, discrepancies, and performance, enabling faster, smarter, and more accurate operational decisions.
RGIS built a web-based dashboard for Sainsbury’s, with multiple user access:
Daily automated transfer of data, eliminated manual transfer of multiple data feeds and enabled data preparation, cleansing, alerts and archiving to be actioned prior to refresh of the dashboard
RGIS worked with Sainsbury’s to scope the required KPIs, along with expected drill-down capabilities for each view
Standard reports were created that can be accessed in a self-serve manner with up-to-date information, with optional development for new requirements and reports ongoing
On-site training for users with ongoing support when needed
Sainsbury’s have an online tool, with external Analyst support, that consolidates vast amounts of data:
The dashboard offers a ‘self-serve’ approach to multiple users, from users who want a high level summary of performance, to analysts who want to extract and manipulate the data themselves
There are four years of data securely archived, with two years of data to view for year-on-year trending
The automated updates of standard reports allow users to view their data online, but also schedule updates or download and view on the move

By utilising the RGIS dashboard, Sainsbury’s gained a secure, self-serve analytics platform with multi-user access, automated reporting, and four years of archived data—empowering teams to track performance, analyse trends, and access up-to-date insights anytime, anywhere.